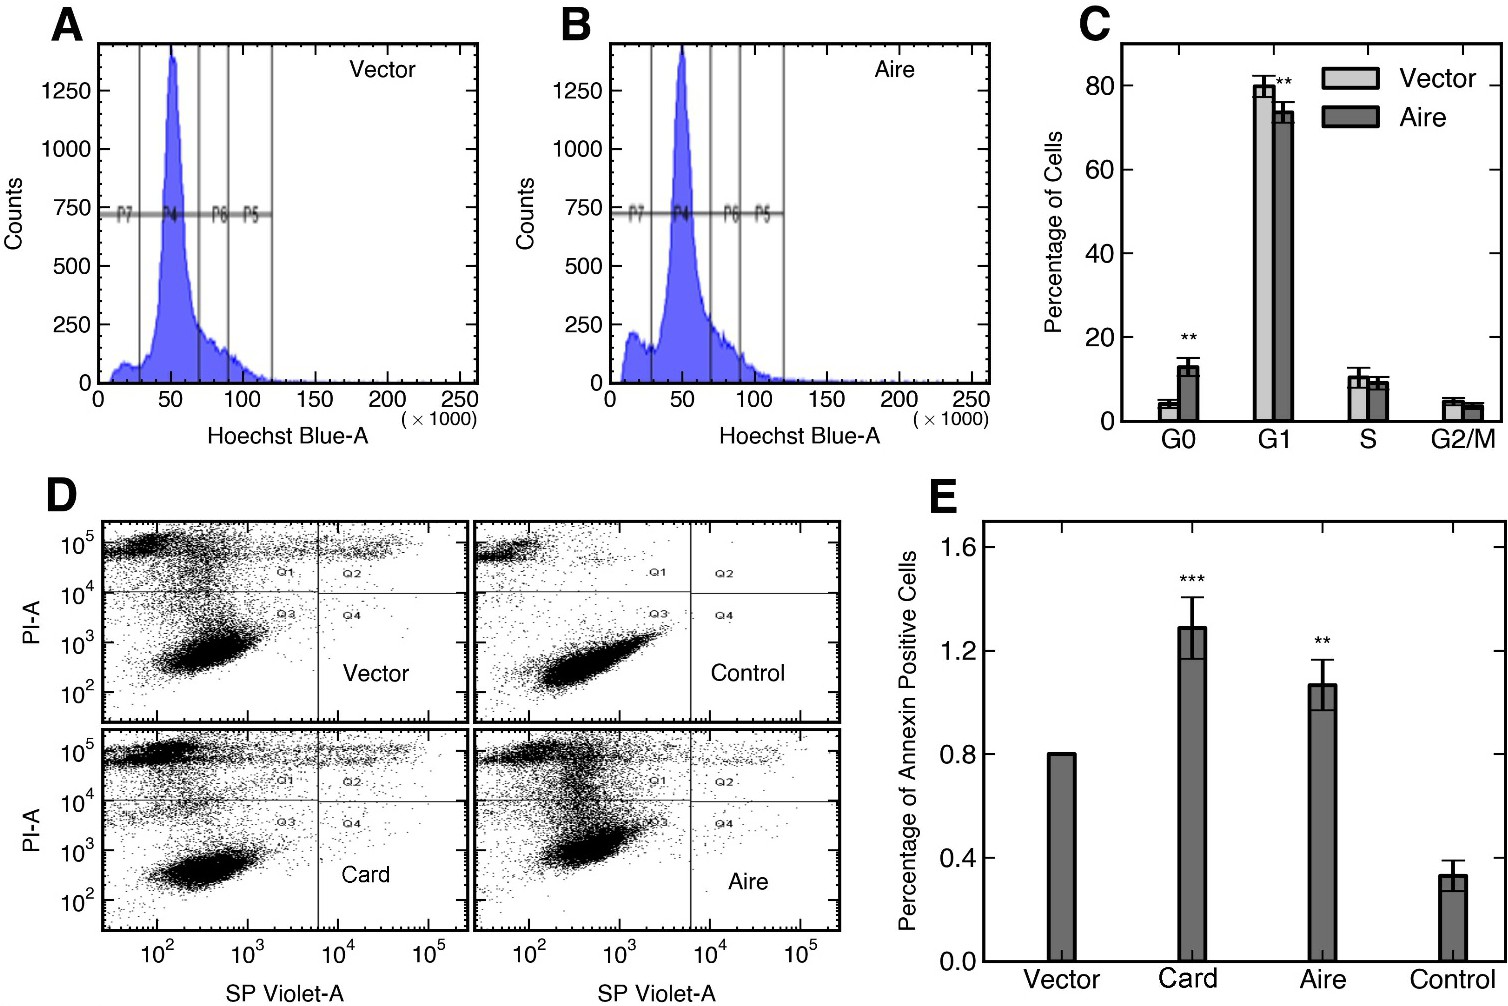
Fig. 6. (A) and (B) Histogram showing cell cycle analysis of GC1 cells over expressing Aire and control Vector (C). Percentage of cells in Sub G0, G1, S and G2/M stages of cell cycle. Data represented here is from four independent transfection represented as Mean ± SEM. p<0.05 for G0 and p<0.05 for G1 phase. Asterisks indicate statistically significant difference versus control. (D) Flow cytometric analysis of Annexin positive cells in GC1 cells, transfected with Vector, CARD and Aire full length are shown. The Q4 population represents the apoptotic annexin positive cells. (E) Graphical representation of percentage of annexin positive cells normalised to vector controls from three independent experiments. Values are represented as Mean ± SEM and Students t-test showed p< 0.001 for card and p< 0.05 for full length.